
Harold Hall


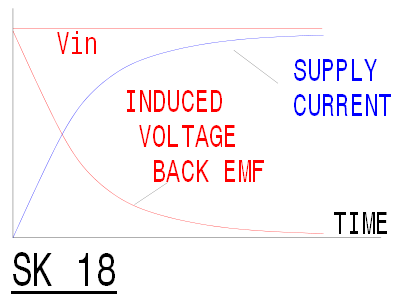
The graph, Sk 18, follows exactly that for the rise in voltage of a capacitor being charged but in this case it is the current that is increasing, calculating the time taken is also similar. This time it is the result of the inductance L being divided by the resistance R, again known as the time constant and giving the time taken for the current to rise to 62.3% of its maximum.
L
TC = ——— seconds
R
For this R will be ohms and L in Henries. Again do note that inductors are normally in milli Henries so a factor of ten to the minus three must be included. Similarly, as is the case with capacitance, the current will continue to rise until after five times the "time constant" the current will have arrived at its maximum.
The calculation is equally applicable to the current decay time giving the time taken for the current to reduce by 62.3% when the supply is removed and a discharge path provided.
If a discharge path is not provided precisely when the supply is removed then the circumstances differ markedly from the situation when a capacitor is disconnected as an inductor cannot retain the energy stored magnetically.
Metalworking
Workshop Data
Sk 19 shows an inductor (typically a relay coil) being switched on (A) and off (B). On switch on the induced voltage will oppose the supply voltage and the current will build up gradually as illustrated in Sk 18. As there is no additional resistance in the circuit the final current will be limited only by the coils own resistance.
Whilst this sequence will delay the operation of the relay it will only be micro seconds due to the values for coil inductance and resistance resulting in a very short time constant.
Now, when the coil is de-